Dummies guide to patching on MacOS with IDA Free
I thought I'd share my journey of using IDA free on MacOS (so I don't forget!)

So it's your first time reverse-engineering a MacOS executable, you've heard about IDA Pro and thought you'd give it a bash? How hard can it be, right? You've come to the right place!
This is going to be a very quick tips and tricks type post, documenting what I've learnt over the last few days. First let's get you up and running.
Install and start debugging
First download and install the Free version of IDA, start it up and drag your executable onto the window and hit the green arrow to start the local debugger (the only option available with the Free version - one of the many limitations). IDA is clever enough to let you choose the MacOS app bundle and it will find the executable. If you didn't know, that's actually a directory containing lots of files and folders.
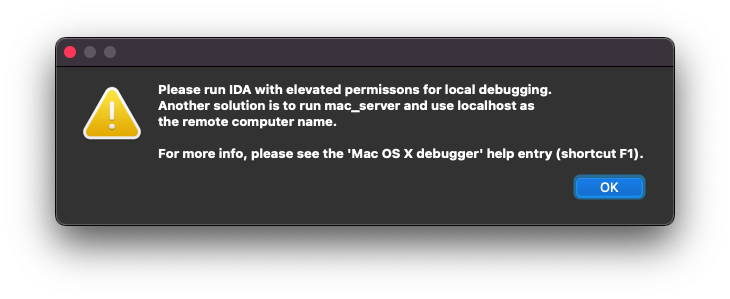
You'll probably immediately notice that it won't let you, and will give you the above error followed by some debugging settings. This is the first hurdle to overcome.
I found I had to run IDA as root from the command line, but I also had to disable System Integrity Protection. This is obviously very unwise if you don't trust the application you are running. If so, try running inside a virtual machine or on a computer or partition that you don't care about.
Useful tips and tricks
IDA will by default present you with the disassembly view. While you can debug in that, there is a much better way! The executable I'm looking at is Objective-C and IDA automatically detects lots of symbols that have been left in. This guide assumes you're looking at something similar.
Function view
My first tip is to go into View -> Open subviews -> Functions.
This will bring up a list of all the functions IDA knows about with hopefully a useful name. Ctrl+F or Quick filter allows you to search for a term related to what you're looking for. If nothing comes up it could be that IDA hasn't finished parsing the symbol tables. You could also try bringing up the Strings view which will take a while to generate a full list of found strings and symbols.
Source-level debugging
Once you've found an interesting looking function, double-click to open the assembly. Make sure you have enabled source-level debugging in the Debugger menu. Right-click in the function and select Switch to source.
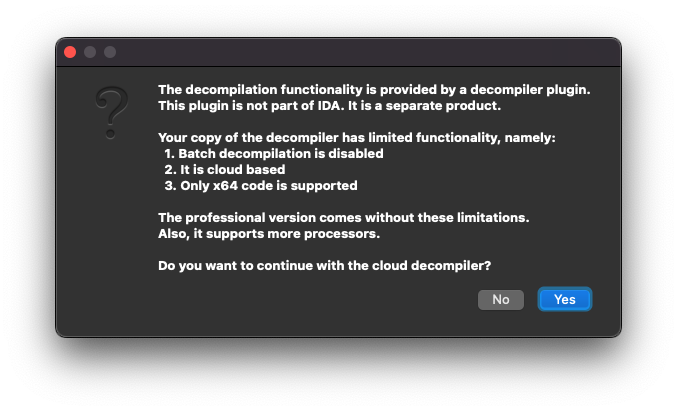
IDA may ask you some questions about whether you want to use their online decompiler. This is also a limitation of the Free version but very well worth it.
As you reverse-engineer the code using the usual Breakpoint, Step into (F7), Step over (F8) and resume (F9) functions, you can select a symbol, press N and give it a name.
Other views & arranging the desktop
It is well worth investigating the other subviews on the View, Debugger -> Debugger windows and right-click menus. In particular:
- Locals: when you hit a breakpoint, will give you a watch window of resolved variables instead of trying to use the CPU registers
- Graph view: when using the disassembly, will break the code up into a flow chart making it easier to understand
- Threads: when paused you can double-click on each thread to go to its code to figure out what each thread is doing
- Call Stack aka Stack Trace: extremely useful for going up the stack to find out who called you and what happens with return values
I didn't find the default view very useful, so once you've enabled your favourite views, you can undock (using the float button) then re-dock by dragging the normally hidden light-grey bar at the top of the window. Drag the view onto the N, S, E, W type icons that pop up over the window ports. If the float button isn't visible, you will need to close some views to make it appear. Remember to Window -> Save desktop to have the layout available next time.
Follow this guide for more info.
Beware: IDA did crash a few times while I was rearranging the desktop.
External qwingraph graphs
In View -> Graphs options, you may find you get an error saying it cannot find qwingraph. This can be useful for the Xrefs graph right-click options. Qwingraph is shipped with IDA but they forgot to link them up once the program is installed.
To do this I had to create two links:
- Link the IDA qt frameworks to a specific directory:
ln -s "/Applications/IDA Freeware 8.4/ida64.app/Contents/Frameworks" /Users/Shared/Qt/5.15.2-x64/lib
- Link the qwingraph executable inside the IDA app:
ln -s "/Applications/IDA Freeware 8.4/qwingraph.app/Contents/MacOS/qwingraph" "/Applications/IDA Freeware 8.4/ida64.app/Contents/MacOS/"
Saving the IDA database
IDA will save all the information it gathers about your application session and your preferences in a database. The database file has extension i64. IDA also creates temporary files in the application directory while it is running. These can have extensions: id0, id1, id2..., nam & til.
Jumping
If you want to go back to where you were a moment ago, the Jump -> Jump to previous position menu item will give you a history to select from.
Patching in IDA
So you've found the instruction you want to patch, and need to find the equal-sized instruction to replace it with. What next?
Edit -> Patch program -> Assemble will let you enter certain simple instructions, but does not support the full set.
Instead I had to break out a real assembler to find a suitable replacement and use Change byte instead.
It is worth noting that the binary executable file is not modified (it is only changed in memory) until you Apply patches to input file.
So create a file called org.s with your instruction (BITS 64 sets it to 64-bit mode):
BITS 64mov rax, r12
Then run:
$ nasm org.s -o org.o$ xxd org.o00000000: 4c89 e0
So now we need to find a 3-byte instruction as a substitute. Obviously your instruction will be different, so you'll need to look up the x86 instruction set to find a suitable replacement. In our example I'll simply create a copy in new.s and change the register:
mov rax, r14$ nasm new.s -o new.o$ xxd new.o00000000: 4c89 f0
Use Change byte in IDA to change the instruction and manipulate your application to run back over the code.
Hey presto, it should do what you wanted!
Patching outside IDA
If you then need to create a tool to patch your application, I recommend using python3 with tkinter to give a simple graphical UI.
You can use python to run external commands to search for the instruction address, check it and overwrite it.
Find the instruction with otool
You will need to ensure XCode Command Line Tools are installed with:
$ xcode-select --install
We'll use otool to search for and disassemble our target function:
$ otool -tv -p "functionHere" /Applications/App.app/Contents/MacOS/App | head -n 50...00000001000493c0 pushq %rbp00000001000493c1 movq %rsp, %rbp00000001000493c4 movq 0x708da5(%rip), %rsi00000001000493cb movl $0x1, %ecx00000001000493d0 popq %rbp00000001000493d1 jmpq *0xa7fdb1(%rip)...
From this listing we can split the line into address and instruction, save the address and check the instruction.
Just beware the assembler instruction syntax will most likely be different between assemblers.
Translate the address
Once we're happy we need to translate the saved virtual address to a file offset using the following equation:
file_architecture_offset + text_segment_offset + our_virtual_address - vm_start_address = file_offset
We can get the file_architecture_offset from otool, if any. Your executable might just be a single architecture without this header, so it could be zero:
$ otool -fv /Application/hereFat headersfat_magic FAT_MAGICnfat_arch 2architecture x86_64cputype CPU_TYPE_X86_64cpusubtype CPU_SUBTYPE_X86_64_ALLcapabilities 0x0offset 16384...
text_segment_offset and vm_start_address can be obtained from the size command:
$ size -m -l -x /Application/hereSegment __PAGEZERO: 0x100000000 (zero fill) (vmaddr 0x0 fileoff 0)Segment __TEXT: 0x8c0000 (vmaddr 0x100000000 fileoff 0)...
In this case the respective values are 0 and 0x100000000
Check and patch the instruction
Now we can open the executable (read, write, binary), seek to the file offset, read the correct number of bytes and check them.
If all is okay, we can re-seek to the correct address and write the new instruction.
Congratulations!
You just learnt how to reverse-engineer and patch a MacOS application using IDA.
No comments yet. Login to start a new discussion Start a new discussion